Trending Data
Data Collection
To measure the improvement of UNM’s culture of health and safety, EHS has implemented robust data collection and analysis procedures. The department began by identifying leading indicators such as training delivered, and lagging indicators such as violations or injuries. Training efficacy is vital for the delivery of appropriate information. EHS has set out to measure effectiveness by comparing inspection deficiencies identified over time, and by conducting follow-up surveys on training. EHS has partnered with Risk Services, Employee Occupational Health and Safety (EOHS), UNM Medical Group, Student Health and Counseling (SHAC), and others to improve incident reporting to capture lagging indicators. In addition to these internal efforts and partnerships, EHS is also proactively seeking the services of an outside consultant with experience in conducting safety culture assessments. The consultant will deliver a strategic plan for making actionable changes after assessing the maturity of UNM’s culture of health and safety. By measuring leading indicators, and lagging indicators, and knowing where we stand concerning our culture of health and safety, EHS intends to direct resources most powerfully and efficiently to improve campus safety.
Trending Data for CY 2025:
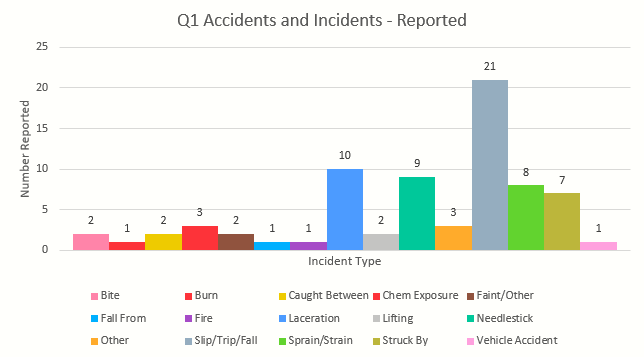
- Quarter 1: January 1st, 2025 to March 31st, 2025
- Total number of reports: 73 (up 2 from Q1 24)
- Most common: Slip/Trip/Fall (21), Laceration (10), and Sprain/Strain (9)
- Least common: Burns, Fall From, Fire, and Vehicle Accident (all 1)
- Quarter 2: April 1st, 2025 to June 30th, 2025
- Total number of reports: 83 (up 8 from Q2 24 & up 10 from Q1 25)
- Most common: Slip/Trip/Fall (17), Laceration (11), and Sprain/Strain (10)
- Least common: Bites and Electrical (both 1)


- Quarter 3: July 1st, 2025 to September 30, 2025
- Total number of reports: 98 (up 14 from Q3 24 & up 15 from Q2 25)
- Most common: Slip/Trip/Fall (20), Struck By (15), and Needlesticks (13)
- Least common: Caught Between, Construction, Fire, Fracture, Lifting, and Vehicle Accident (all 1)

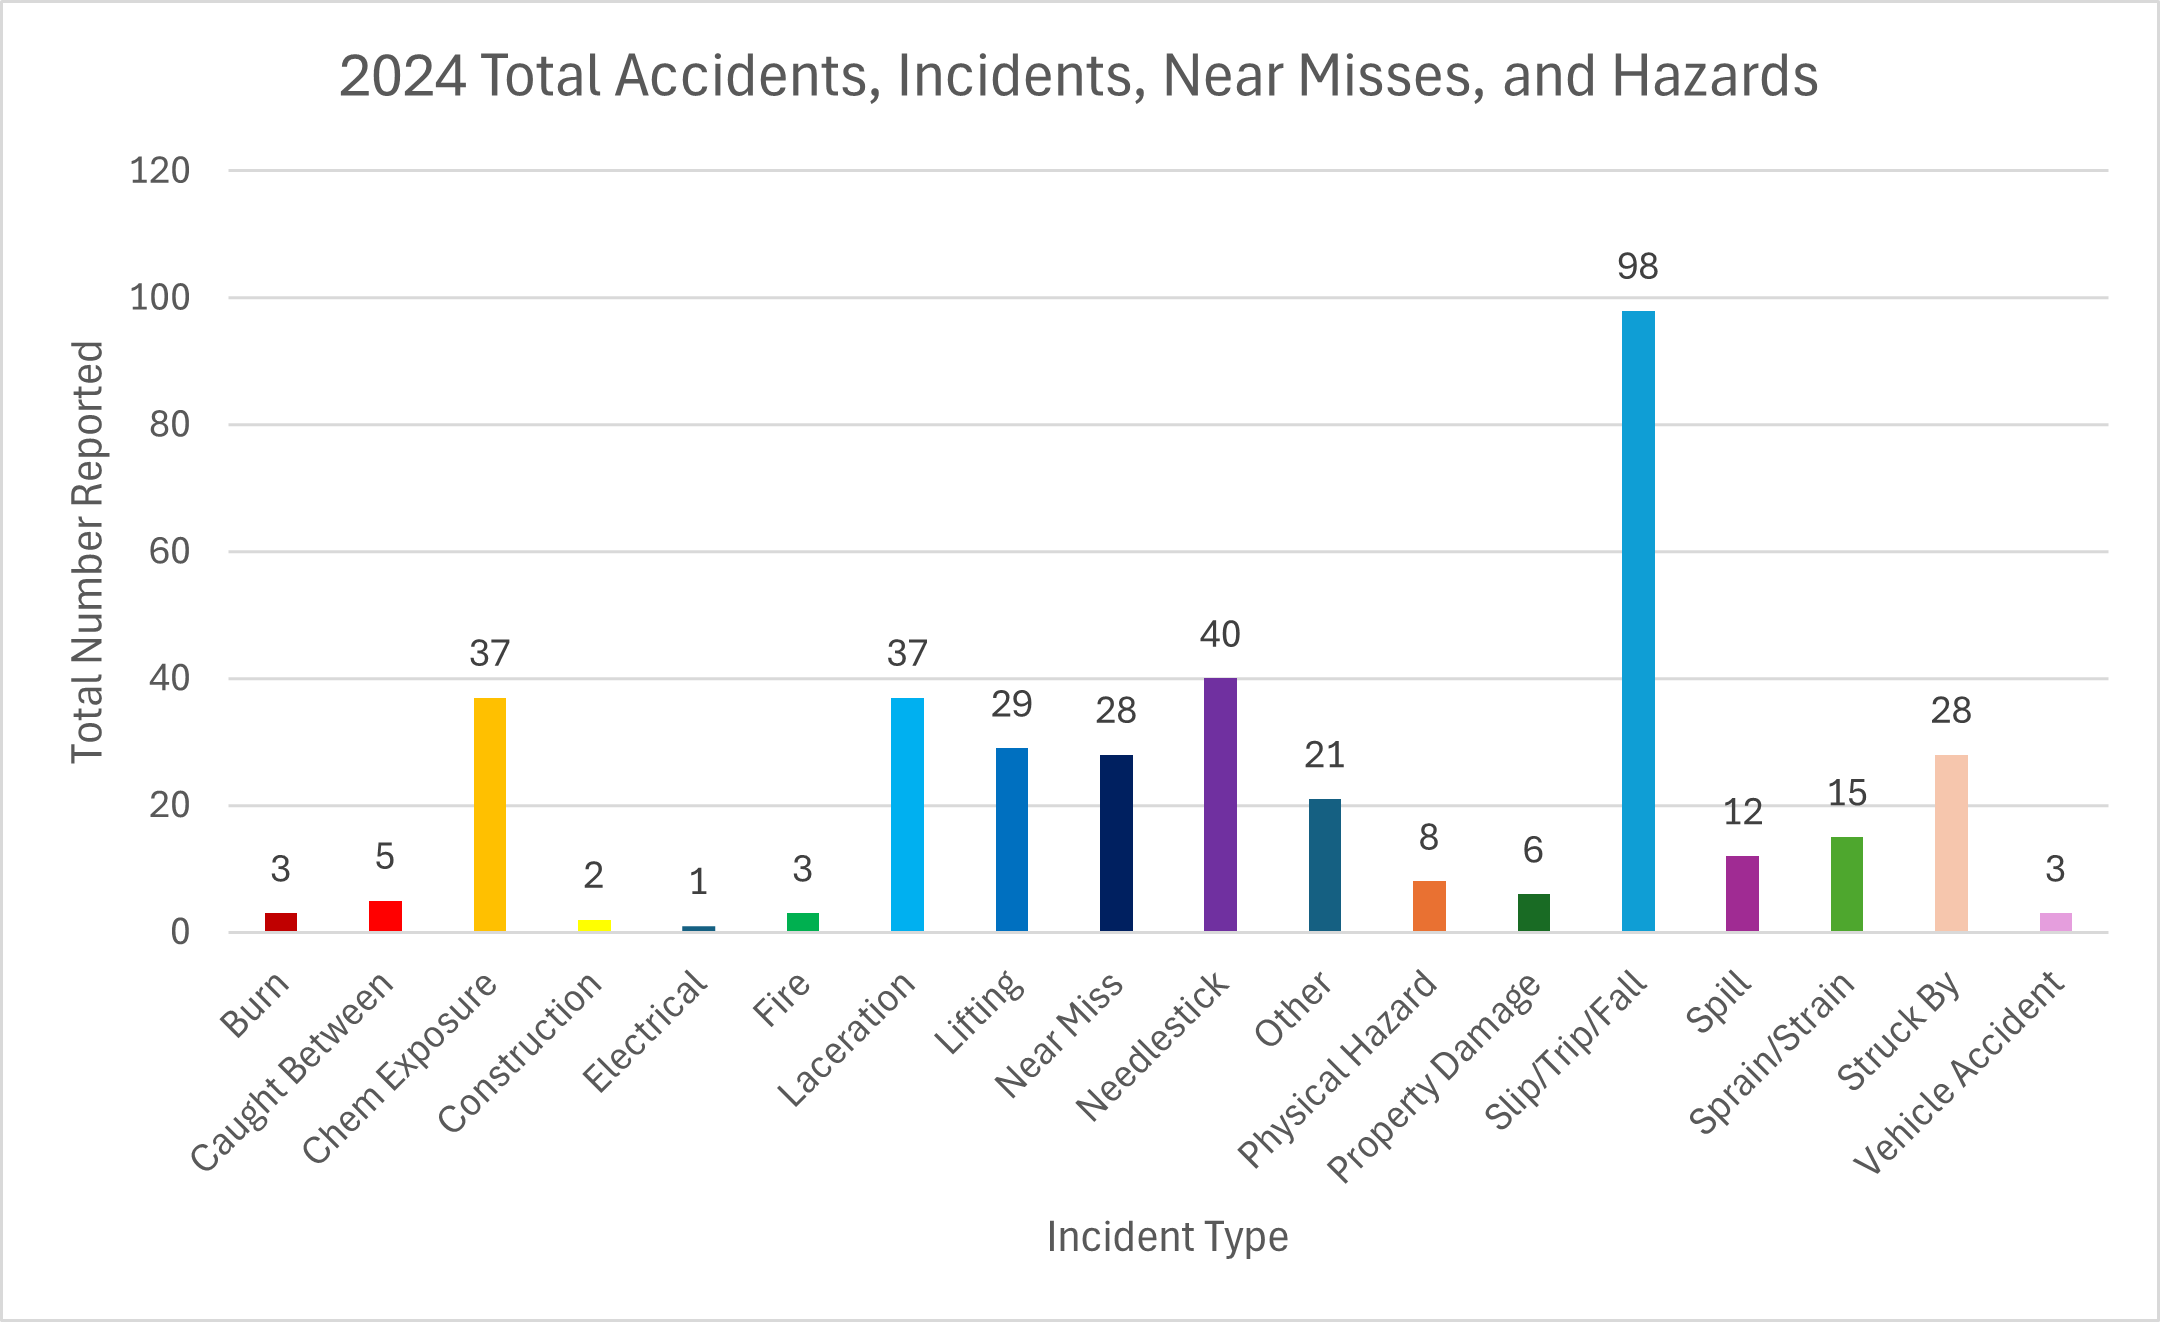
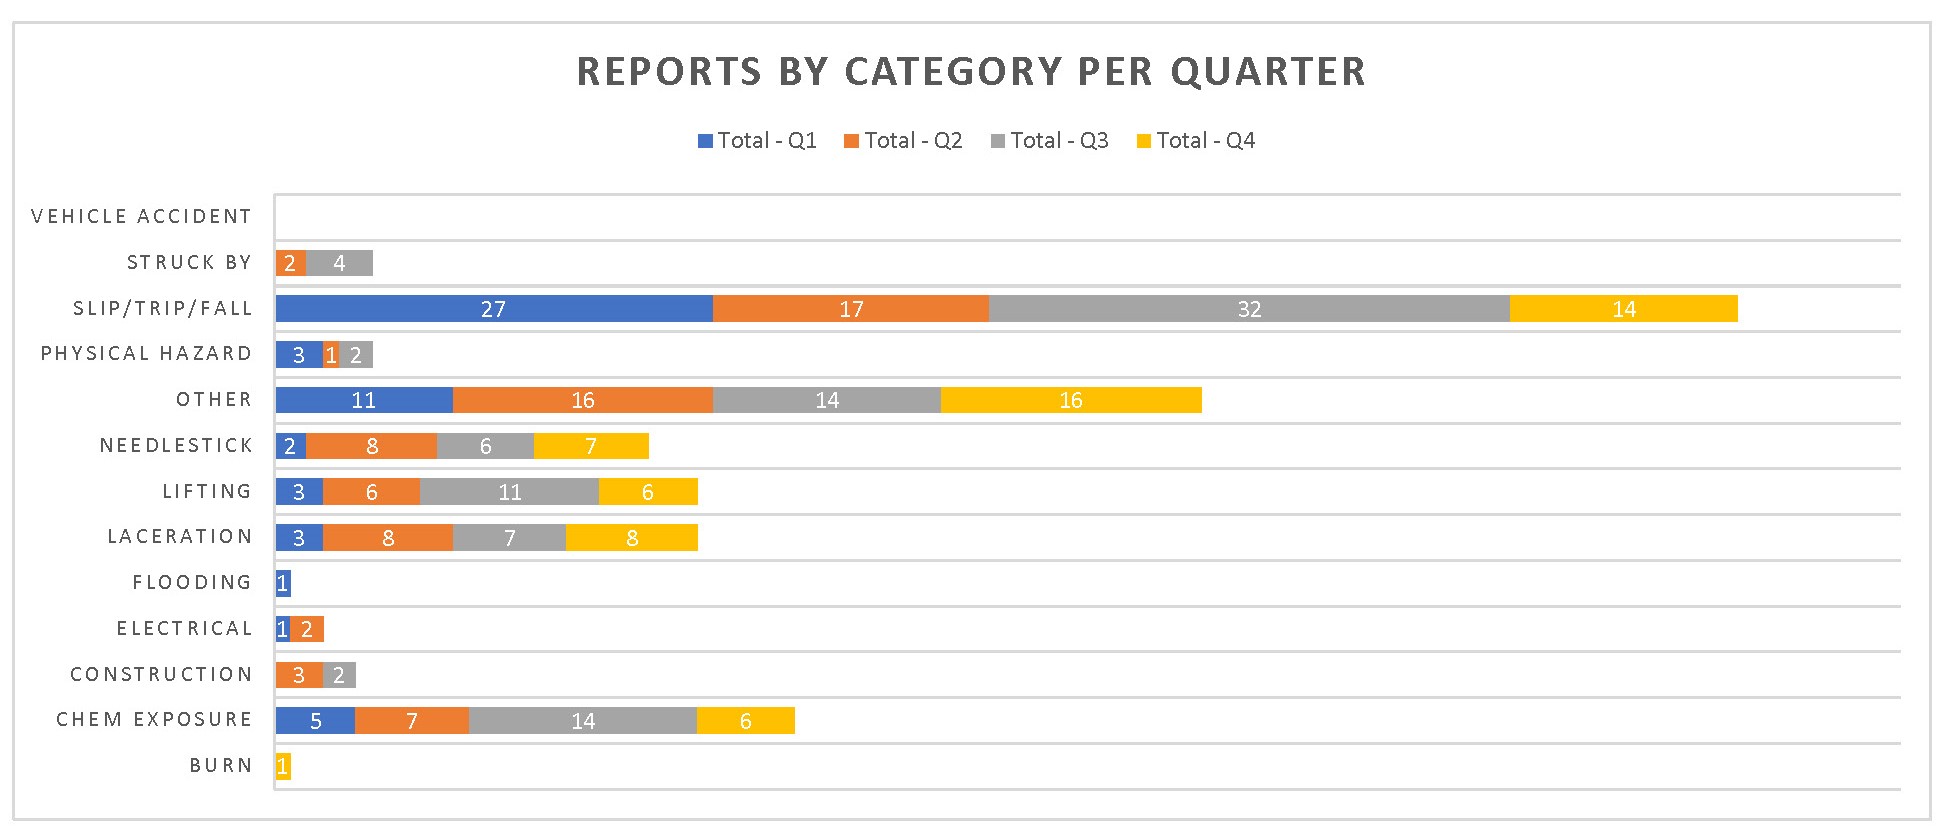
2024 Accident and Incident Data:

2023 Accident and Incident Data:


